
The CAGR formula in Excel, and the number of years to divide by
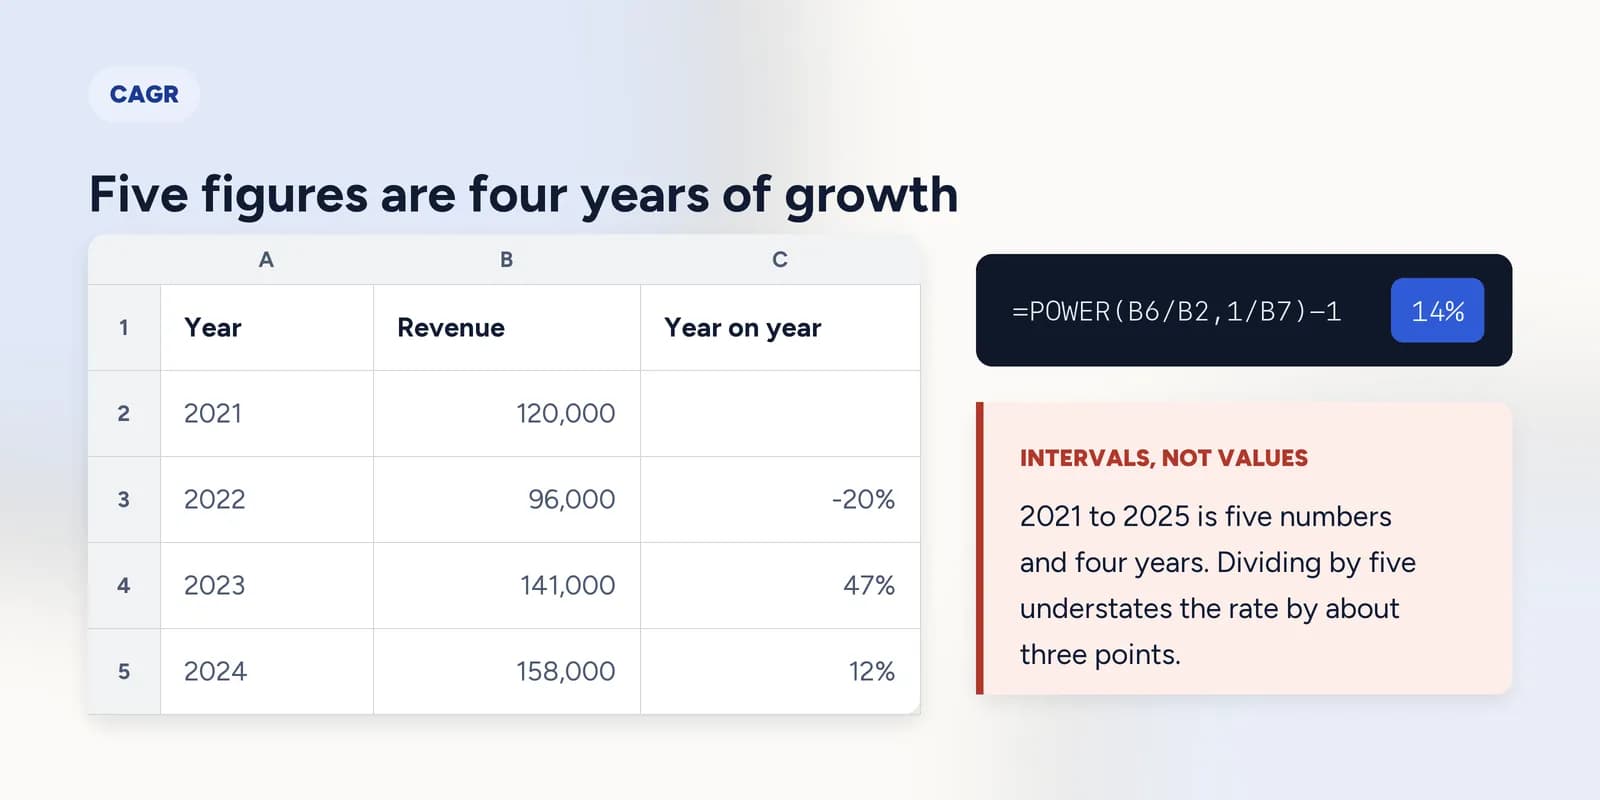
The compound annual growth rate in Excel is =POWER(end/start, 1/years) - 1, written against cells as =POWER(B6/B2, 1/B7) - 1 and formatted as a percentage. The years figure is the number of periods between the two values, not the number of values: five annual figures from 2021 to 2025 are four years of growth, and dividing by five understates the rate.

CAGR answers a specific question: if this had grown by the same percentage every year, what percentage would that have been? It is a smoothed rate, not a description of what happened, and that distinction is the whole reason it is both useful and frequently misleading.
There is no CAGR function in Excel. The formula is one line, and the only part that catches people is how many years to divide by.
End over start, to the power of one over years
Divide the ending value by the starting value to get the total growth factor, take the nth root of it where n is the number of years, then subtract one to turn a factor into a rate. POWER with a fractional exponent is how Excel takes a root.
| A | B | C | |
|---|---|---|---|
| 1 | Year | Revenue | Year on year |
| 2 | 2021 | 120000 | |
| 3 | 2022 | 96000 | -20% |
| 4 | 2023 | 141000 | 47% |
| 5 | 2024 | 158000 | 12% |
| 6 | 2025 | 203000 | 28% |
| 7 | Years | 4 | |
| 8 | CAGR | 14% |
=POWER(B6/B2,1/B7)-1Revenue from 120,000 to 203,000 over four years. Formatted as a percentage the cell reads 14%.
Five figures, four years
This is the mistake, and it is almost universal. The number in the exponent is the count of intervals between the first and last values, not the count of values. Annual figures for 2021 through 2025 are five numbers and four years of growth.
=A6-A2Last year minus first year: four. Subtracting the years is more reliable than counting rows, and it keeps working when a year is missing.
=POWER(B6/B2,1/COUNT(B2:B6))-1The same data divided by five instead of four. It is about three points lower, which is a large enough gap to change a decision and small enough to go unchallenged.
What CAGR does not tell you
CAGR depends on exactly two numbers, the first and the last. Everything in between is discarded, which is the point and also the catch.
- It is unaffected by volatility. The revenue above fell twenty per cent in its second year, and the CAGR says nothing about that. Quote the year-on-year column beside it or the smoothed figure is the only story anybody hears.
- It is extremely sensitive to the endpoints. Starting one year earlier or later can move it by several points, which is why a CAGR quoted without its period is not a figure at all.
- It cannot be calculated from a negative or zero starting value. The division gives a meaningless ratio and the root of a negative number returns #NUM!.
- It is not the average of the yearly rates. Averaging the year-on-year column gives a different and larger number, because an average ignores compounding.
=AVERAGE(C3:C6)The mean of the yearly changes, which is several points above the CAGR. Both are correct answers to different questions, and only one of them reaches the right endpoint.
CAGR is built on percentage change, so that is the thing worth getting automatic first: new minus old, over old, with a row that fell to catch the denominator being the wrong way round.
Percentage change between two years
New minus old, divided by old. Get the denominator wrong and every figure in the report is wrong. · 5 min · Paid plan
What goes wrong
These are the four mistakes that come up again and again. Each one is reasonable. That is why people make it.
Dividing by the number of data points
WhyFive annual figures feels like five years, and COUNT over the range returns five without complaint.
InsteadUse the number of intervals: last year minus first year, or COUNT minus one. Five figures are four years of growth.
Quoting a CAGR without its period
WhyIt is a single clean percentage and sounds like a property of the business.
InsteadAlways say over what. The same data gives materially different rates depending on which year you start from.
Averaging the yearly growth rates instead
WhyIt is the obvious thing to do with a column of percentages and AVERAGE accepts them.
InsteadUse the CAGR formula. An average ignores compounding and gives a rate that does not reach the actual ending value.
Common questions
What is the CAGR formula in Excel?
=POWER(end/start, 1/years) - 1, formatted as a percentage. Against cells that is =POWER(B6/B2, 1/B7) - 1. The caret form =(B6/B2)^(1/B7)-1 is identical.
Is there a CAGR function in Excel?
No. RRI(nper, pv, fv) does the same calculation in some versions and is worth knowing about, but POWER works everywhere and is the form most people will recognise.
How many years do I divide by for CAGR?
The number of intervals, not the number of figures. Annual values for 2021 to 2025 are five numbers and four years, so the exponent is one over four.
Why does my CAGR return #NUM!?
The starting value is zero or negative, so the ratio cannot be rooted. There is no meaningful compound growth rate from a negative base; report the absolute change instead.
Is CAGR the same as average annual growth?
No. The average of the yearly rates ignores compounding and comes out higher. CAGR is the single rate that actually reaches the ending value from the starting one.