
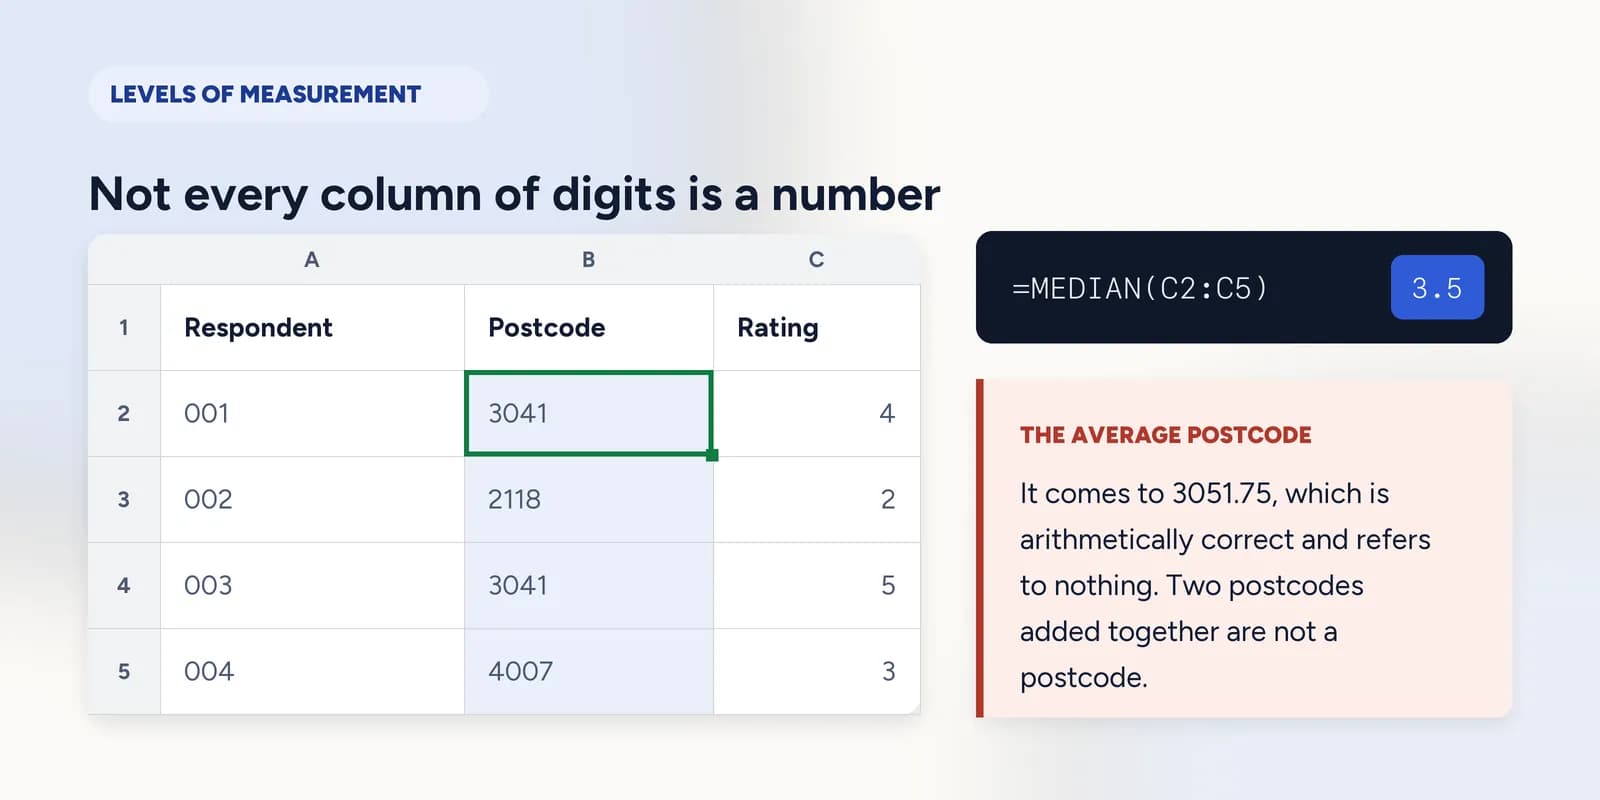
What kind of data is this, and which sums are allowed
Not every column of digits is numerical. A postcode is a label that happens to be written with numbers, and averaging it is meaningless. The four levels of measurement, nominal, ordinal, interval and ratio, each permit a different set of operations, and the level is a fact about what the data represents rather than about how it is stored.

This is the one part of the course that is not about Excel. It is about the question nobody asks before they start calculating, which is what kind of data they are actually holding.
It matters because Excel will average anything you point it at. It has no opinion about whether the average of a set of postcodes means something, and it will give you an answer to six decimal places either way. The check has to happen before the formula.
Digits are not the same as numbers
The first cut is between categorical data, which labels things, and numerical data, which measures them. The confusing cases are the categories written with digits: postcodes, employee IDs, phone numbers, survey option codes. They look numerical to Excel and to the eye, and they are labels.
| A | B | C | D | |
|---|---|---|---|---|
| 1 | Respondent | Postcode | Rating | Spend |
| 2 | 1 | 3041 | 4 | 28.5 |
| 3 | 2 | 2118 | 2 | 14 |
| 4 | 3 | 3041 | 5 | 63.25 |
| 5 | 4 | 4007 | 3 | 9.8 |
The test is whether the arithmetic has a meaning outside the spreadsheet. Two postcodes added together are not a postcode, and the gap between 3041 and 2118 is not a distance. Two prices added together are a price, and the gap between them is a difference in money. That is the whole distinction.
Four levels, each allowing more than the last
- Nominal: labels with no order. Region, product, postcode. You can count how many of each there are and name the most frequent, and that is all. There is no average.
- Ordinal: ordered, but the gaps are not equal or not known. Survey ratings, seniority, finishing positions. Median and quartiles are meaningful; the mean is arguable, because the distance from 1 to 2 is not demonstrably the distance from 4 to 5.
- Interval: equal gaps, but no true zero. Temperature in Celsius, calendar years. Differences are meaningful, ratios are not: 20°C is not twice as hot as 10°C.
- Ratio: equal gaps and a real zero meaning none. Money, weight, counts, durations. Every statistic is available, and ratios make sense, so 60 is genuinely twice 30.
=MEDIAN(C2:C5)The ratings are ordinal, so the median is the honest summary. The mean of 1-to-5 ratings is everywhere in practice and rests on an assumption the scale does not support.
Why this turns up in real reports
The average rating is the canonical example. A mean of 4.2 out of 5 sounds precise and compresses a distribution that might be mostly fives and a cluster of ones into a single number that nobody in the sample actually gave. The counts of each rating say more and cannot mislead in that direction.
The second place it bites is sorting and joining. An ID column stored as a number loses its leading zeros, so 001 becomes 1, and a lookup against the original list stops matching. The fix is to store identifiers as text from the start, which is really the same decision as recognising that they are labels.
What goes wrong
These are the mistakes this part exists to prevent. Each one is reasonable, which is why people make it and why nothing on the sheet objects.
Averaging an ID or postcode column
WhyIt is a column of numbers, AVERAGE accepts it, and the answer looks like every other figure in the report.
InsteadAsk whether the arithmetic means anything outside the sheet. If adding two values does not produce something of the same kind, it is a label.
Quoting a mean rating without the distribution
WhyOne number is easier to put in a summary than a bar chart, and 4.2 out of 5 sounds both precise and good.
InsteadGive the median and the counts per rating. If the mean is quoted at all, it should be beside something that shows the shape.
Letting Excel store identifiers as numbers
WhyNothing objects when you type them, and the leading zeros only disappear at the moment of entry when you are looking elsewhere.
InsteadFormat the column as text before entering anything, or import with that column set to text. Recovering lost leading zeros afterwards means knowing how many there were.
Common questions
What is the difference between categorical and numerical data?
Categorical data labels things; numerical data measures them. The test is whether arithmetic on the values means anything: two prices add up to a price, two postcodes do not add up to anything.
What are nominal, ordinal, interval and ratio?
Four levels of measurement. Nominal is unordered labels, ordinal is ordered with unequal gaps, interval has equal gaps but no true zero, and ratio has equal gaps and a real zero. Each level permits more statistics than the one before.
Can you average a rating out of five?
Excel will, and people do constantly. Strictly a rating is ordinal, so the median and the counts of each rating are the defensible summaries. A mean assumes the gap between 1 and 2 equals the gap between 4 and 5, which a rating scale does not guarantee.
Why does Excel delete the leading zero in my ID?
It read the entry as a number, and numbers have no leading zeros. Format the column as text first, or type an apostrophe before the value, which forces Excel to store it as text.