
Turning a list into a finding
Percentage change is new minus old, divided by old: =(C2-D2)/D2. The denominator is always the earlier figure, and getting it the wrong way round produces a number that looks reasonable and is not. A weighted average is SUMPRODUCT of the values and their weights divided by the total weight, which is a different number from AVERAGE whenever the rows are different sizes.

The arithmetic in this part is not difficult. What makes it worth its own section is that each of these calculations has a wrong version that produces a plausible number rather than an error, and the wrong versions turn up in real reports constantly.
A figure nobody can check is worse than no figure. The habit this part is really teaching is sanity-checking your own output: knowing roughly what the answer should be before you read it.
Percentage change, and which number goes underneath
Percentage change is the difference divided by what you started from. The old figure is always the denominator, because the question is how much it changed relative to where it was.
| A | B | C | D | |
|---|---|---|---|---|
| 1 | Course | Students | Score | Last year |
| 2 | Intro | 120 | 61 | 58 |
| 3 | Advanced | 14 | 88 | 81 |
| 4 | Workshop | 30 | 74 | 79 |
| 5 | Clinic | 6 | 95 | 90 |
=(C2-D2)/D2Up from 58 to 61: a rise of about five per cent. Divide by the new figure instead and you get a different number that is just as believable.
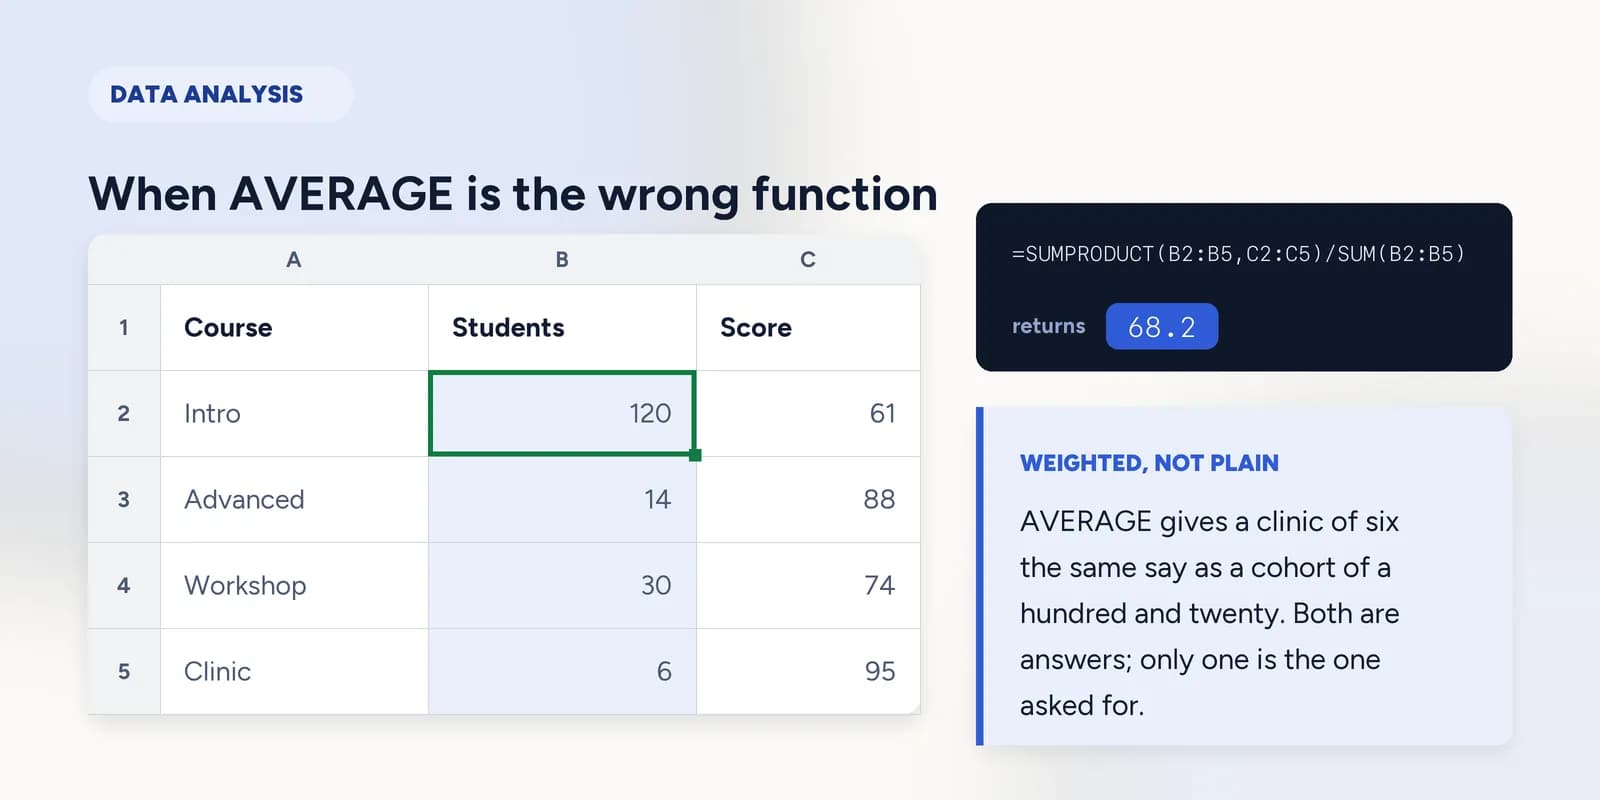
When AVERAGE is the wrong function
AVERAGE gives every row the same say. That is correct when the rows are comparable, and wrong when they are not. Four courses with 120, 14, 30 and 6 students are not comparable: the plain average of the four scores treats a clinic of six people as equal in weight to a cohort of a hundred and twenty.
=AVERAGE(C2:C5)The average of the four course scores, as if each course were the same size.
=SUMPRODUCT(B2:B5,C2:C5)/SUM(B2:B5)The average score of a student. SUMPRODUCT multiplies each score by its student count and totals the lot, then the division turns it back into a per-student figure.
The gap between those two numbers is the whole argument. The first answers what is the average course score, the second answers what did the average student score, and the big cohort with the lowest score drags the second one down. Both are defensible; quoting one while meaning the other is not.
Pivot tables, and errors you should not hide
A pivot table groups rows and summarises them without any formulas at all. Ten rows of a sales log become three rows by region in about four clicks, and changing the grouping is a drag rather than a rewrite. It is the right tool the moment you find yourself writing the same SUMIF for the fourth category.
IFERROR belongs here because a column of #DIV/0! in a report is the usual reason people reach for it. A campaign with no impressions yet genuinely has no click rate, and showing a blank is reasonable. What is not reasonable is wrapping every formula in IFERROR as a matter of habit, which converts every future mistake into a tidy empty cell.
=IFERROR(C2/B2,"")Safe here because the only error this division can produce is a division by zero. Over a lookup, IFNA is the narrower and better choice.
What goes wrong
These are the mistakes this part exists to prevent. Each one is reasonable, which is why people make it and why nothing on the sheet objects.
Dividing by the new figure in a percentage change
WhyBoth numbers are in front of you and either order returns something plausible. Nothing in the result announces which one was underneath.
InsteadNew minus old, over old. Check the sign and the rough size against what you know happened.
Averaging percentages or rates directly
WhyThey are numbers in a column and AVERAGE accepts them without complaint.
InsteadWeight them by whatever they were rates of. The average of two conversion rates is not the conversion rate of the two campaigns combined.
Wrapping everything in IFERROR
WhyIt makes a report look finished, and the errors it hides were real errors you had already seen and decided to tolerate.
InsteadCatch the specific error you expect. IFNA for lookups, a condition on the divisor for division. A blanket IFERROR hides the next bug as well as this one.
Common questions
What is the formula for percentage change in Excel?
=(new-old)/old, for example =(C2-D2)/D2. Format the result as a percentage. The earlier figure is always the denominator.
How do I calculate a weighted average in Excel?
=SUMPRODUCT(weights, values)/SUM(weights). SUMPRODUCT multiplies each pair and adds them up; dividing by the total weight brings it back to the same scale as the values.
When should I use a pivot table instead of SUMIF?
When you want several groupings, or expect the grouping to change. One or two fixed totals are simpler as formulas; a summary you will reorganise is quicker and more flexible as a pivot.
Why does my pivot table not show new data?
Pivot tables read a snapshot of the source range and need refreshing. Right-click and choose Refresh, and extend the source range if rows were added below it.
What is the difference between IFERROR and IFNA?
IFERROR catches every error value. IFNA catches only #N/A. Around a lookup, IFNA is safer because a genuine #REF! stays visible instead of being replaced by your friendly message.