
Practical challenges, and how to approach a sheet you did not write
The method for an unfamiliar spreadsheet is the same every time: find out where the numbers come from before changing anything, check the totals against something independent, and look hardest at the cells that currently look correct. A formula that happens to give the right answer today is a fault that has not surfaced yet.

There are no new functions in this part. Everything in it has appeared earlier in the course, and what is being practised is the thing that is actually difficult: deciding which tool the situation calls for when nobody has told you.
That is also the shape of real work. Nobody hands you a task labelled use SUMIFS. They hand you a spreadsheet that is wrong, or a question, and the first move is working out what you are looking at.
Reading a sheet before changing it
The instinct with a broken report is to start fixing. The better first move is to find out where every number comes from, because a report with three faults usually has at least one you will create yourself by correcting the others in the wrong order.
- Press Ctrl+` to show formulas instead of results. The whole sheet's structure becomes visible at once, including the cells that hold a typed-in number where everybody assumed there was a formula.
- Check every total's range against the data it is meant to cover. A range that stops short is the most common single fault in a real workbook.
- Run COUNT beside anything you are about to trust, and compare it against the rows you can see.
- Look for inconsistency down a column. A filled column where one cell differs from its neighbours is nearly always the fault.
Building a check into your own work
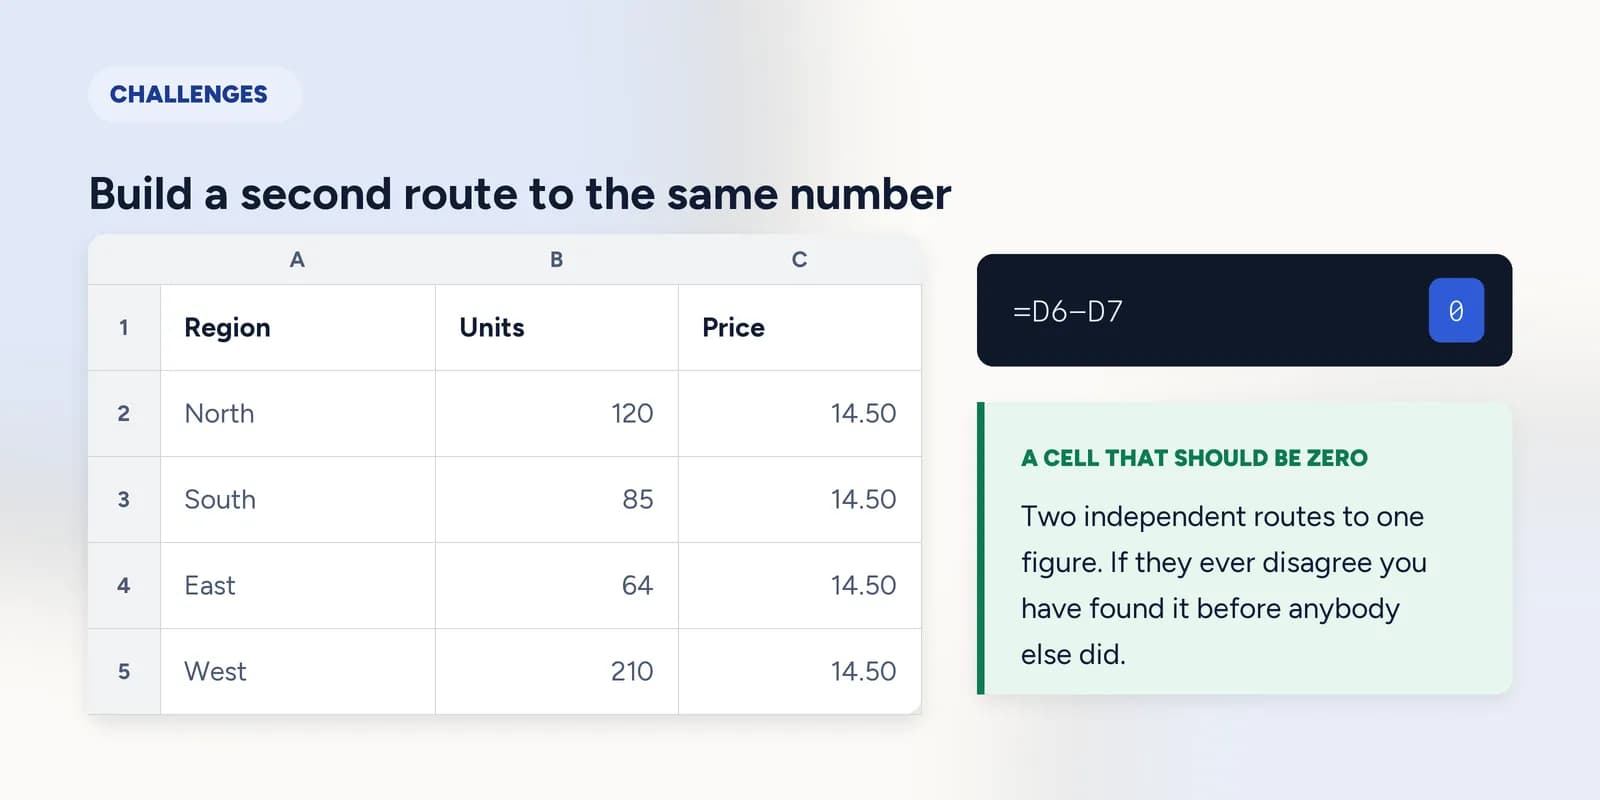
A check is a second route to the same number. If the two agree, both are probably right. If they disagree, you have found something before anybody else did, which is the entire point.
| A | B | C | D | |
|---|---|---|---|---|
| 1 | Region | Units | Price | Revenue |
| 2 | North | 120 | 14.5 | 1740 |
| 3 | South | 85 | 14.5 | 1232.5 |
| 4 | East | 64 | 14.5 | 928 |
| 5 | West | 210 | 14.5 | 3045 |
| 6 | Total | 479 | 6945.5 | |
| 7 | Check | 6945.5 |
=D6-D7The check in its most useful form: a cell that should always be zero. Anything else is a signal, and it is visible at a glance.
The second route has to be genuinely independent. Totalling a column twice with the same range proves nothing. Totalling across as well as down, or deriving the figure from different inputs, is what makes the agreement informative.
Choosing the tool when nobody tells you
Most real questions decompose into a small number of shapes, and recognising which one you have is most of the work.
- How many, or how much, but only some rows: COUNTIF, SUMIF, or their plural forms when there is more than one condition.
- I know one thing about a row and want another: a lookup. XLOOKUP if it is available, INDEX with MATCH if it is not.
- The answer depends on a threshold: IF, and the first thing to settle is what happens exactly on the boundary.
- The same summary for every category: a pivot table, as soon as there are more than two or three categories.
- The data is the wrong shape: the text functions, with TRIM first.
What goes wrong
These are the mistakes this part exists to prevent. Each one is reasonable, which is why people make it and why nothing on the sheet objects.
Fixing the first fault you find
WhyIt is visible, you know how to fix it, and fixing things feels like progress.
InsteadMap the whole sheet first. Corrections interact, and a report with three faults can end up with four.
Checking a total by recalculating it the same way
WhyIt produces the same number, which feels like confirmation.
InsteadUse a genuinely different route: across instead of down, or from different inputs. Two identical methods agreeing proves only that Excel is consistent.
Accepting a number because the formula ran
WhyNo error appeared, and the figure is plausible, which is the entire problem with plausible figures.
InsteadDecide what you expect before you look. A number you cannot sanity-check is a number you cannot defend in a meeting.
Common questions
How do I check a spreadsheet for errors?
Press Ctrl+` to see formulas rather than results, check every total's range against its data, look for a cell in a filled column that differs from its neighbours, and total at least one figure a second way.
What are good Excel practice exercises?
Ones that describe an outcome rather than a method, so you have to choose the function yourself. Fixing a deliberately broken report is particularly useful, because diagnosis is the skill real work demands.
How can I tell if a cell has a hard-coded number instead of a formula?
Click it and look at the formula bar, or press Ctrl+` to show formulas across the whole sheet. A typed-in number sitting in a column of formulas is one of the most common faults in an inherited workbook.
What should I practise to get better at Excel?
Lookups, conditional totals and IF cover most of real spreadsheet work. After those, the thing worth practising is checking: building a second route to a number, and noticing when two figures that should agree do not.